Revolutionizing Legal Reporting: 100% Retention & Improved Decision-Making

Revolutionizing Legal Reporting: 100% Churn-Risk Retention & Improved Decision-Making
01. Project Overview:
Problem:
Our corporate legal team users needed help visualizing and tracking the impact of their efforts to reduce outside legal costs. The existing reporting system was data-heavy, overwhelming, and challenging to navigate. Users were frustrated by the lack of accessible insights, making it hard to prove the value of their legal operations.
From a business perspective, inadequate reporting led to client dissatisfaction, with critical customers threatening to churn. We also lost new business deals due to the need for more sophisticated data visualization and analytics reporting.
Impact:
As lead designer, I transformed an overwhelming and outdated legal reporting system into a user-friendly, visually intuitive tool. The solution dramatically improved user satisfaction, leading to 100% retention of at-risk clients. It transformed complex data into clear visual narratives that helped users make better decisions, reduce legal costs, and improve operational efficiency.
02. My Role:
I was responsible for:
The end-to-end design process of 16 new out-of-the-box reports.
Creating a component design library to ensure consistency of future report designs
Implementing a storytelling approach to report design to answer user needs
Collaborating with product managers, engineers, and cross-functional teams to bring the solution to life
Training teams on reporting standards and ensuring post-implementation consistency.
I led the design efforts, but I also played a crucial role in motivating an engineering team that had seen two previous attempts at solving this problem fail. My partnership with the product and engineering teams ensured buy-in and successful execution.
03. The Challenge:
User Challenges:
Users were overwhelmed by massive amounts of unfiltered data and reports that lacked clear differentiation. The filtering functionality was inconsistent, and there needed to be more visuals to guide users through the data, resulting in frustration and inefficiency. During user research, we discovered that users couldn’t easily find the reports they needed, leading to a lack of trust in the reporting system.
Business Challenges:
There were two previous failed attempts to solve the reporting issue:
The first involved in-app data tables that users had to export and analyze manually using external tools like Excel.
The second was implementing a paid reporting solution, Tableau, which proved costly and difficult for our non-technical users to adopt.
These failures frustrated clients, created risks of client churn, and lost business opportunities.
04. The Process
Research & Analysis:
We conducted extensive user research to understand the core issues. One key finding was that users needed clarity and ease in accessing actionable insights from their data. We also gathered feedback from the engineering team, which had experienced two failed attempts. Understanding these pain points informed the direction of the design.
Design Strategy:
I created a reusable component library to streamline the reporting design process, ensuring scalability and consistency. This "sub-design system" enabled us to build out-of-the-box reusable charts and visualizations tailored to user needs.
Collaboration & Buy-In:
To overcome engineering resistance, I involved them early, allowing them to choose the stack (Superset, an open-source Business Intelligence tool) they were most comfortable working with, which helped shift the conversation from “Is this possible?” to “How can we make this useful for our users?”
I also worked closely with the product team to identify user needs for each report. We deciphered what users were trying to accomplish, tracked down relevant data sources, and bundled data types together for more insightful reporting.
Testing & Iteration:
The design process involved alpha and beta testing with users, collecting feedback, and iterating on the report designs. We ensured the reporting interface was intuitive, using storytelling techniques to present actionable and precise data.
5. The Solution
We designed and launched an award-winning analytics product that improved legal operations transparency, allowing our users to make better decisions, reduce legal costs, and increase operational efficiency. Key elements of the solution included:

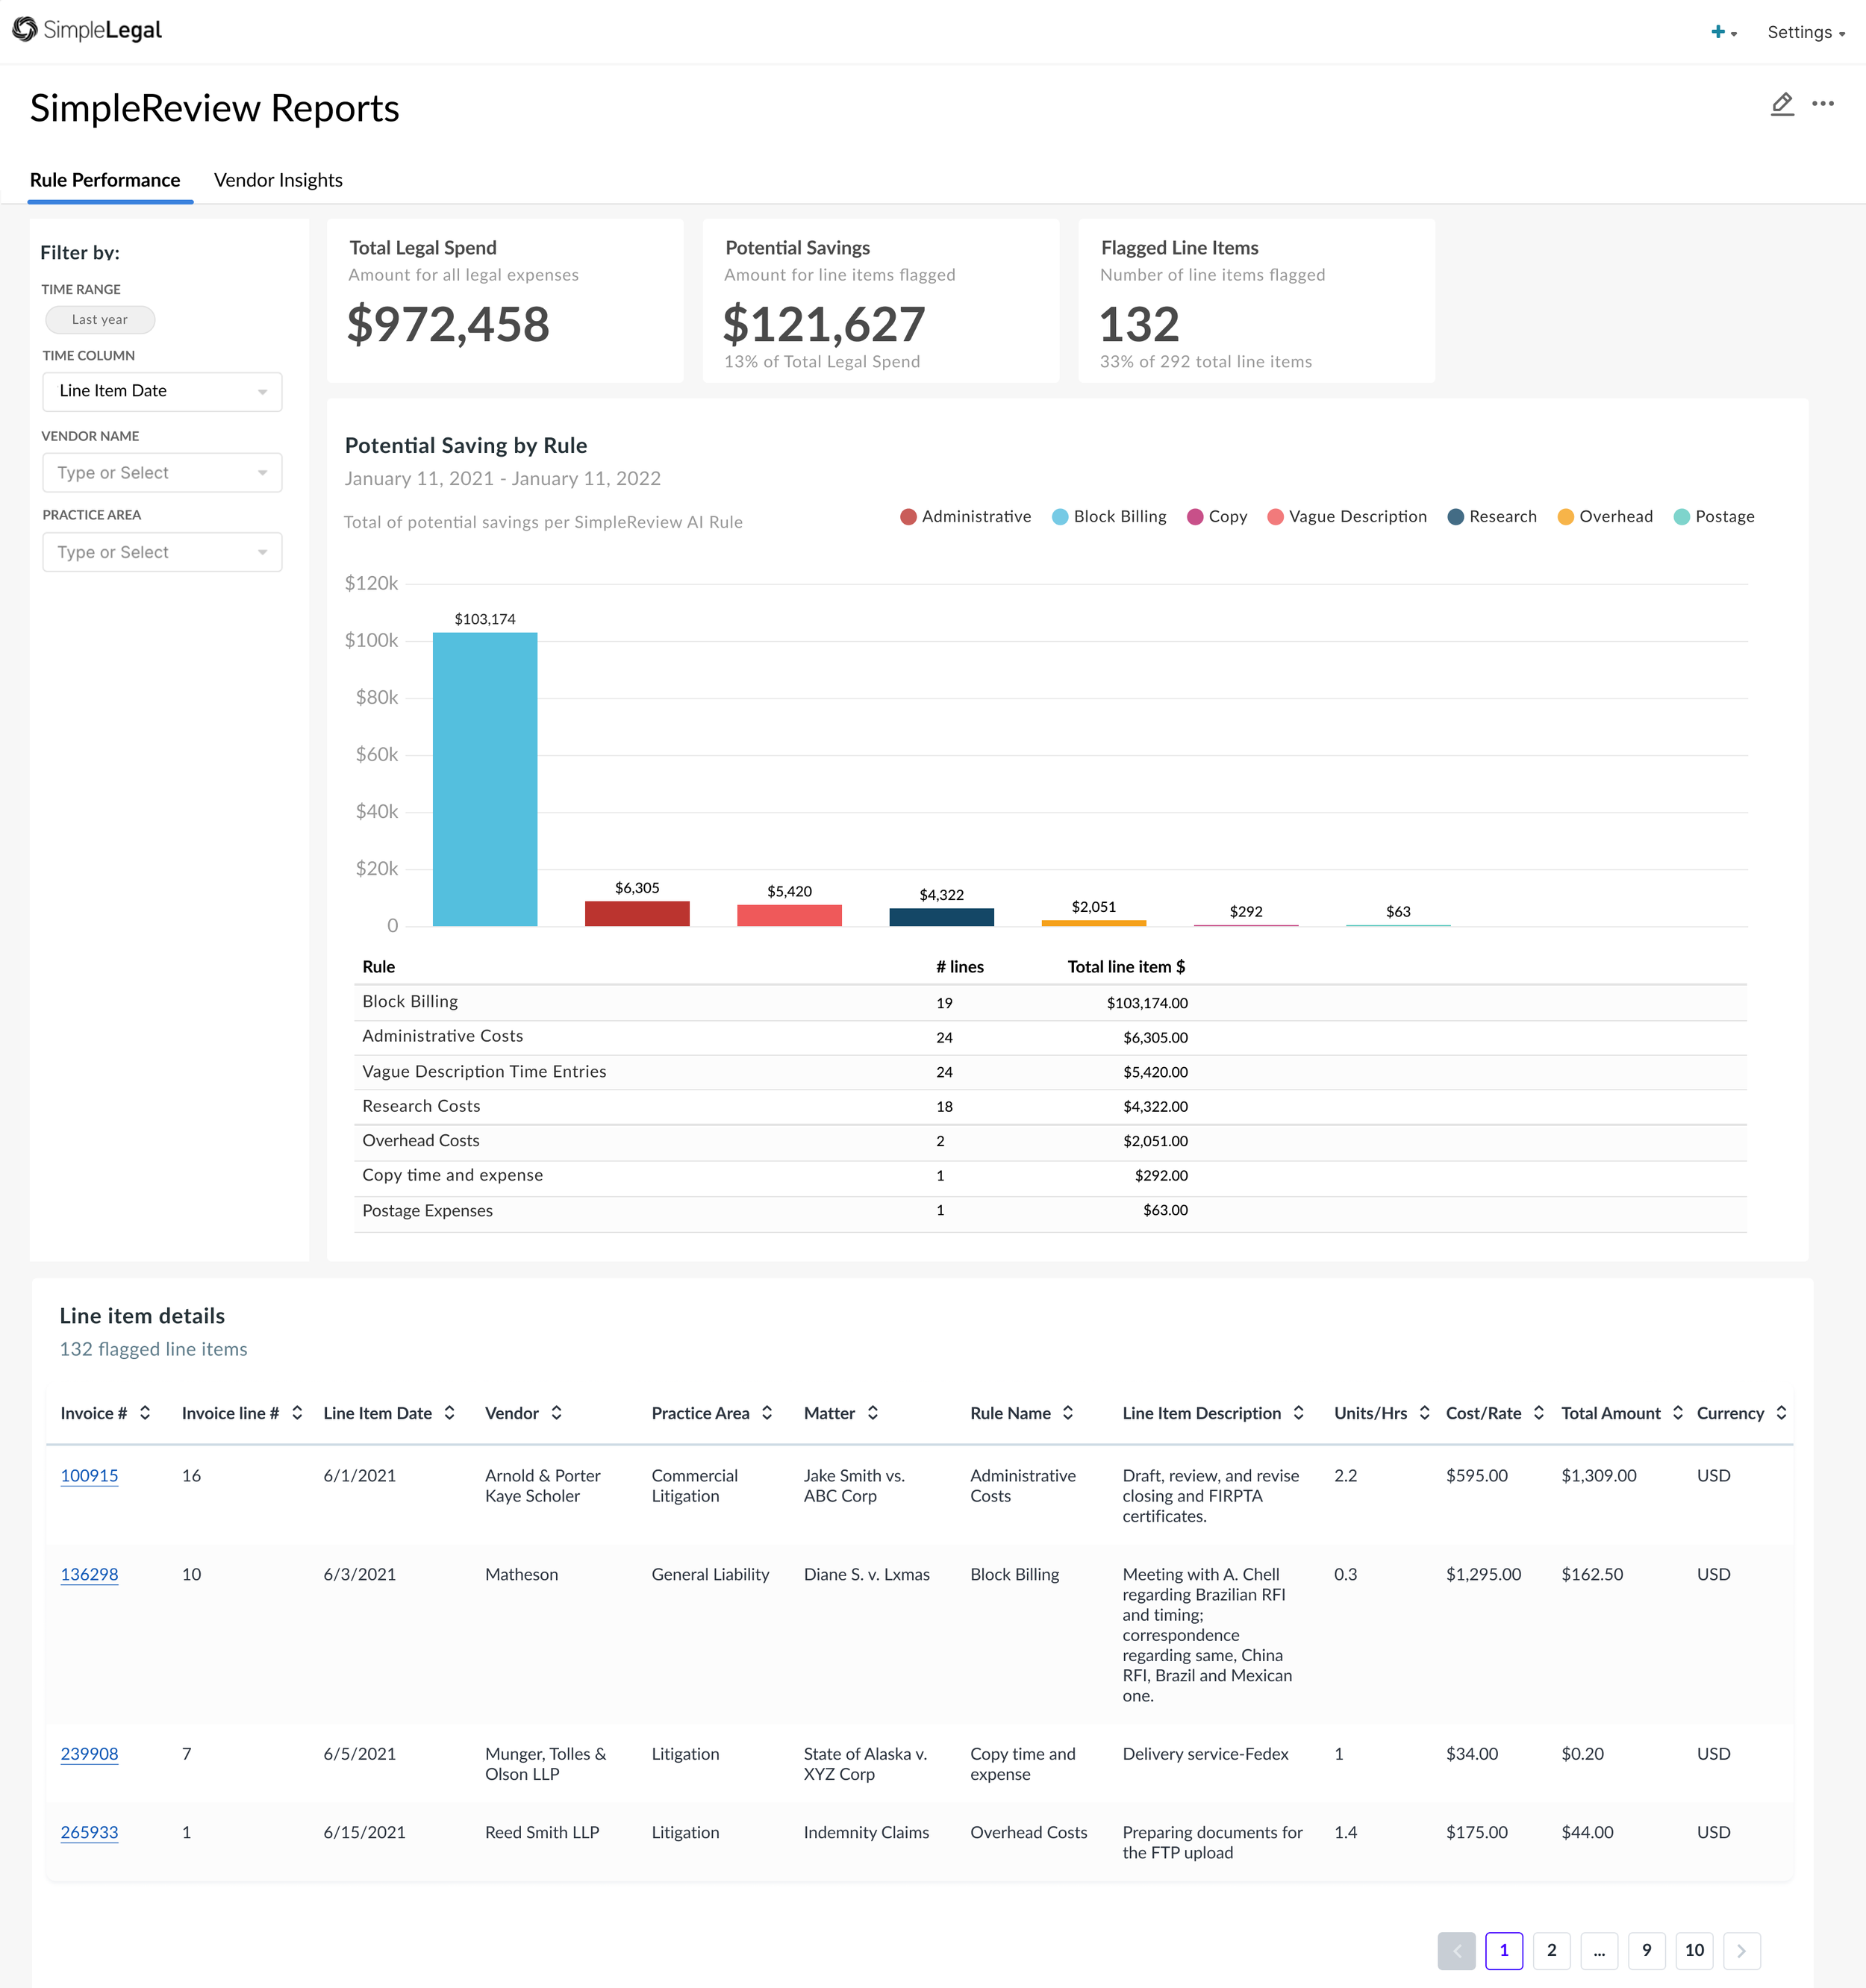
This is a report showing the efficacy of AI invoice billing rules at finding invoice violations created for legal operations teams to mitigate over billing.

This is a report showing the AI invoice billing violations by vendor created for legal operations teams to streamline communications of violations.
Storytelling in Data: Reports designed to provide clear, actionable insights that answer users' most pressing questions. We focused on minimizing complexity and delivering relevant information through intuitive visualizations.
Reusable Components: The component library allowed for the creation of consistent, scalable reports that designers could customize to user needs without reinventing the wheel.
Cost-Effective Solution: Unlike Tableau, our solution was more cost-effective for the business and our users. By using a familiar vocabulary and constraining the system to the legal industry’s needs, we reduced the learning curve and increased user adoption.

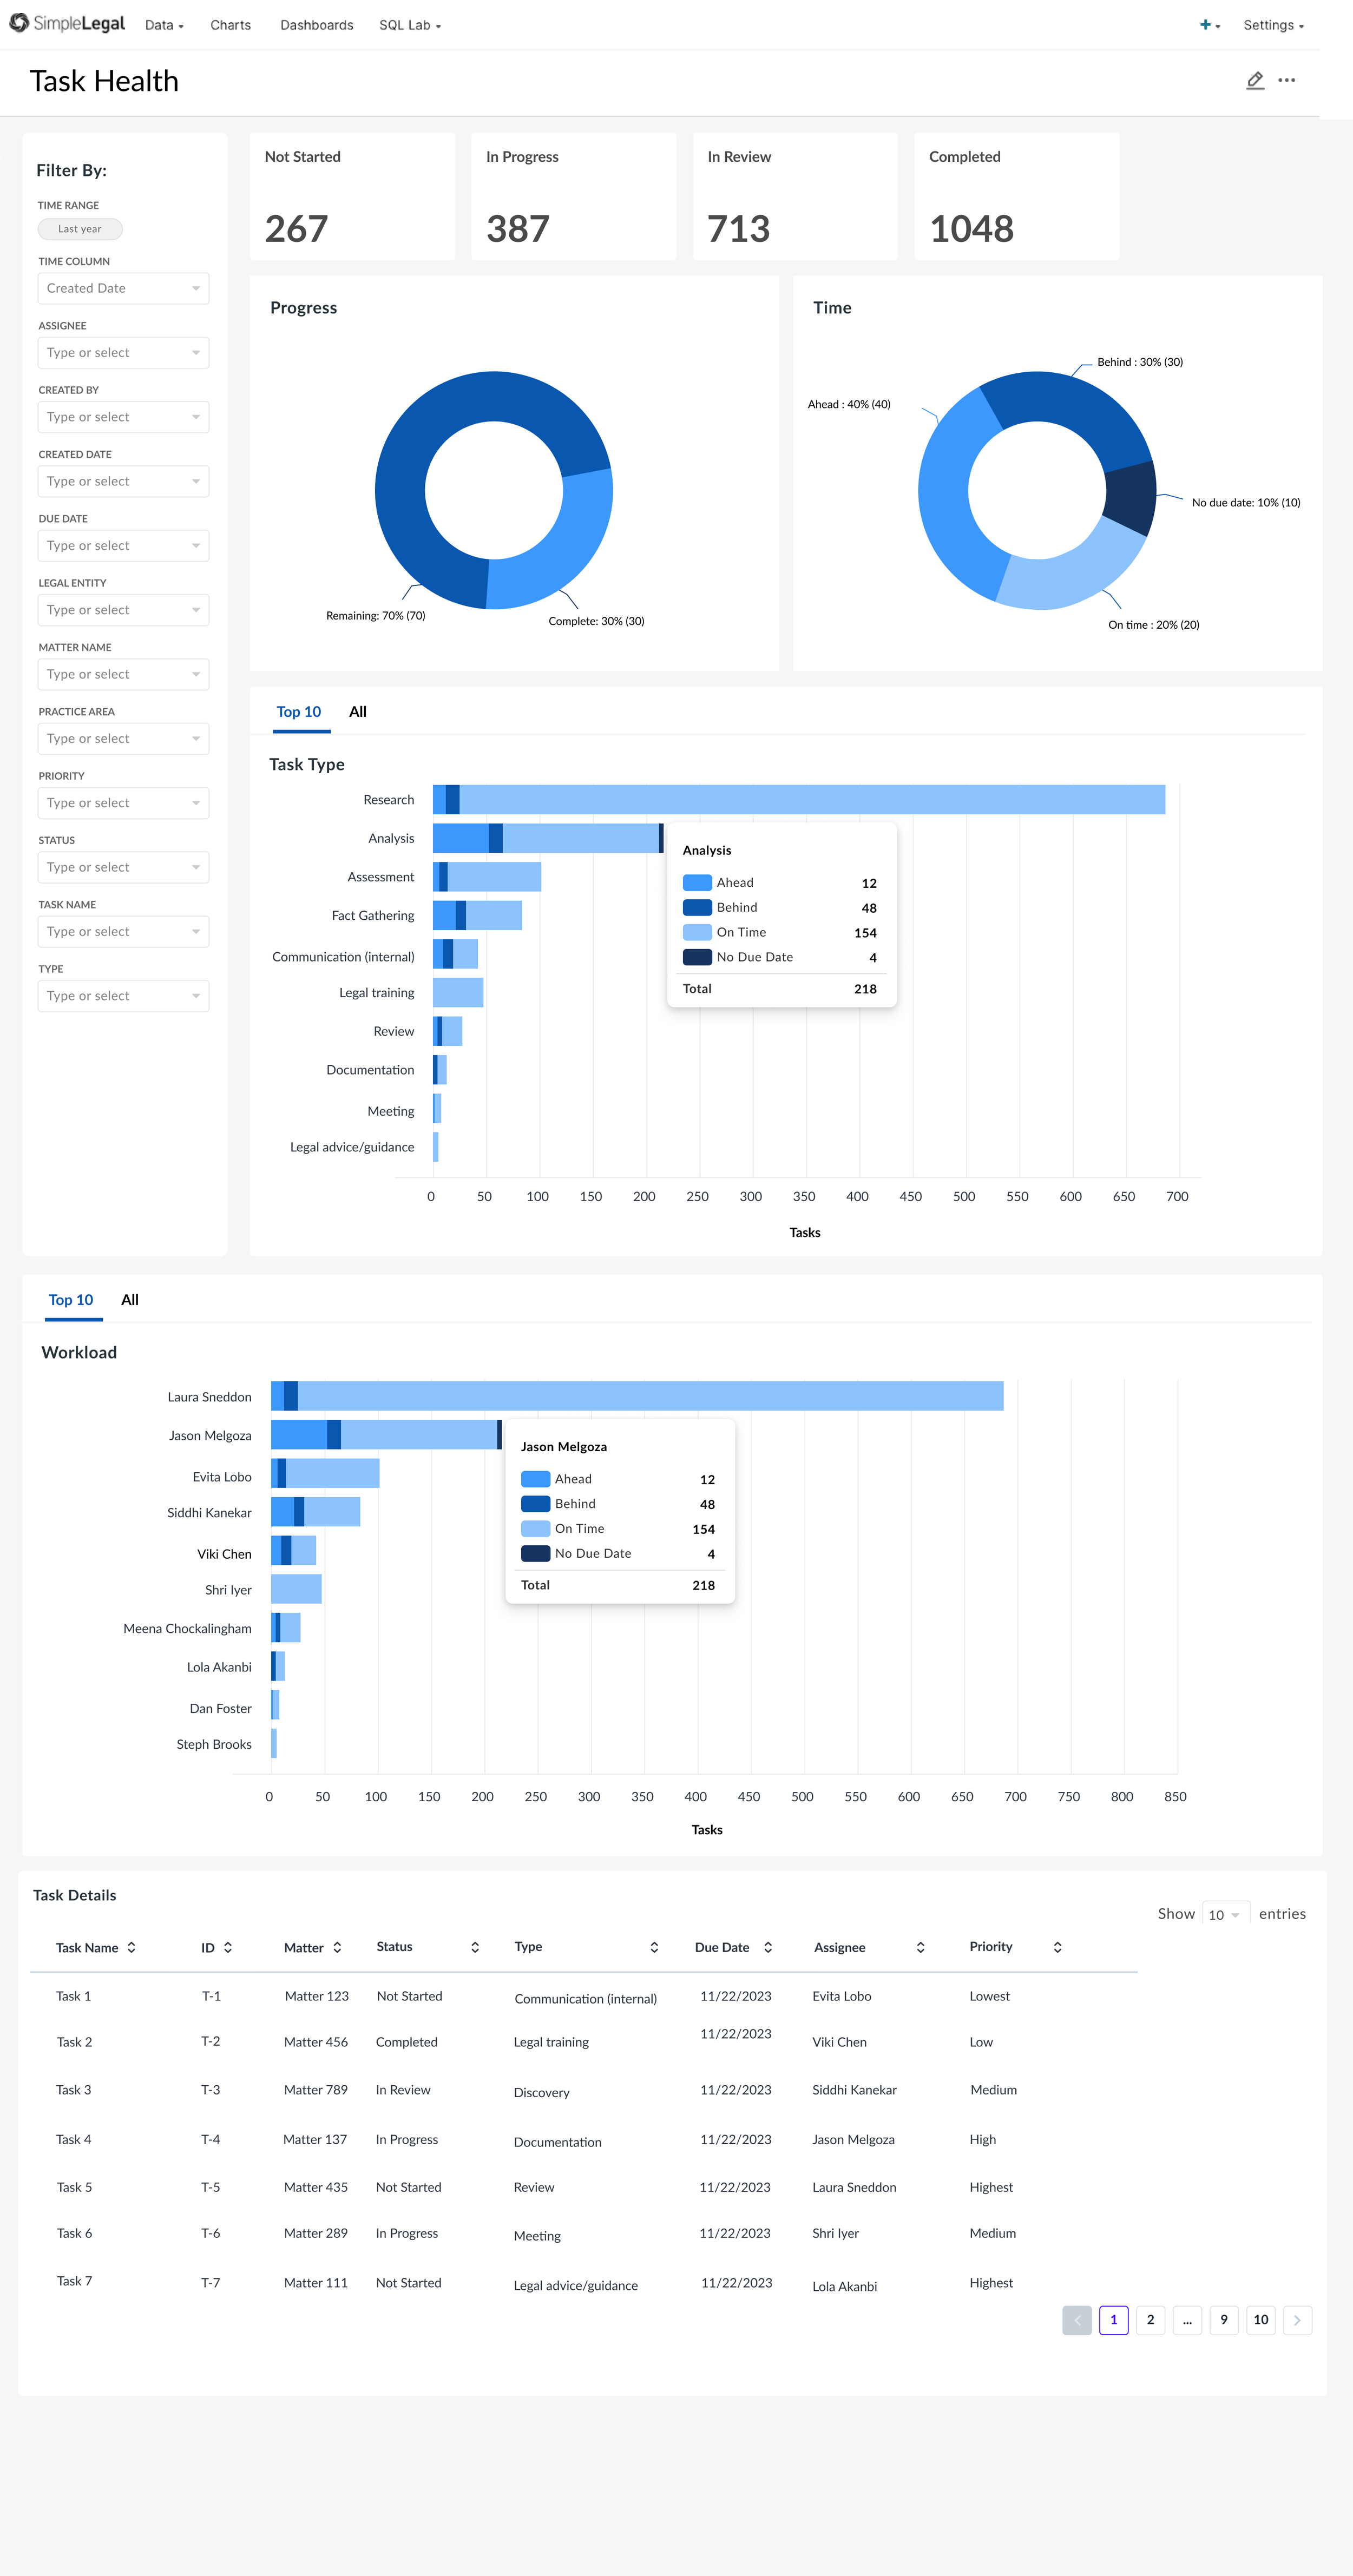
This report shows different views of task statuses to help legal operations optimize task completion.

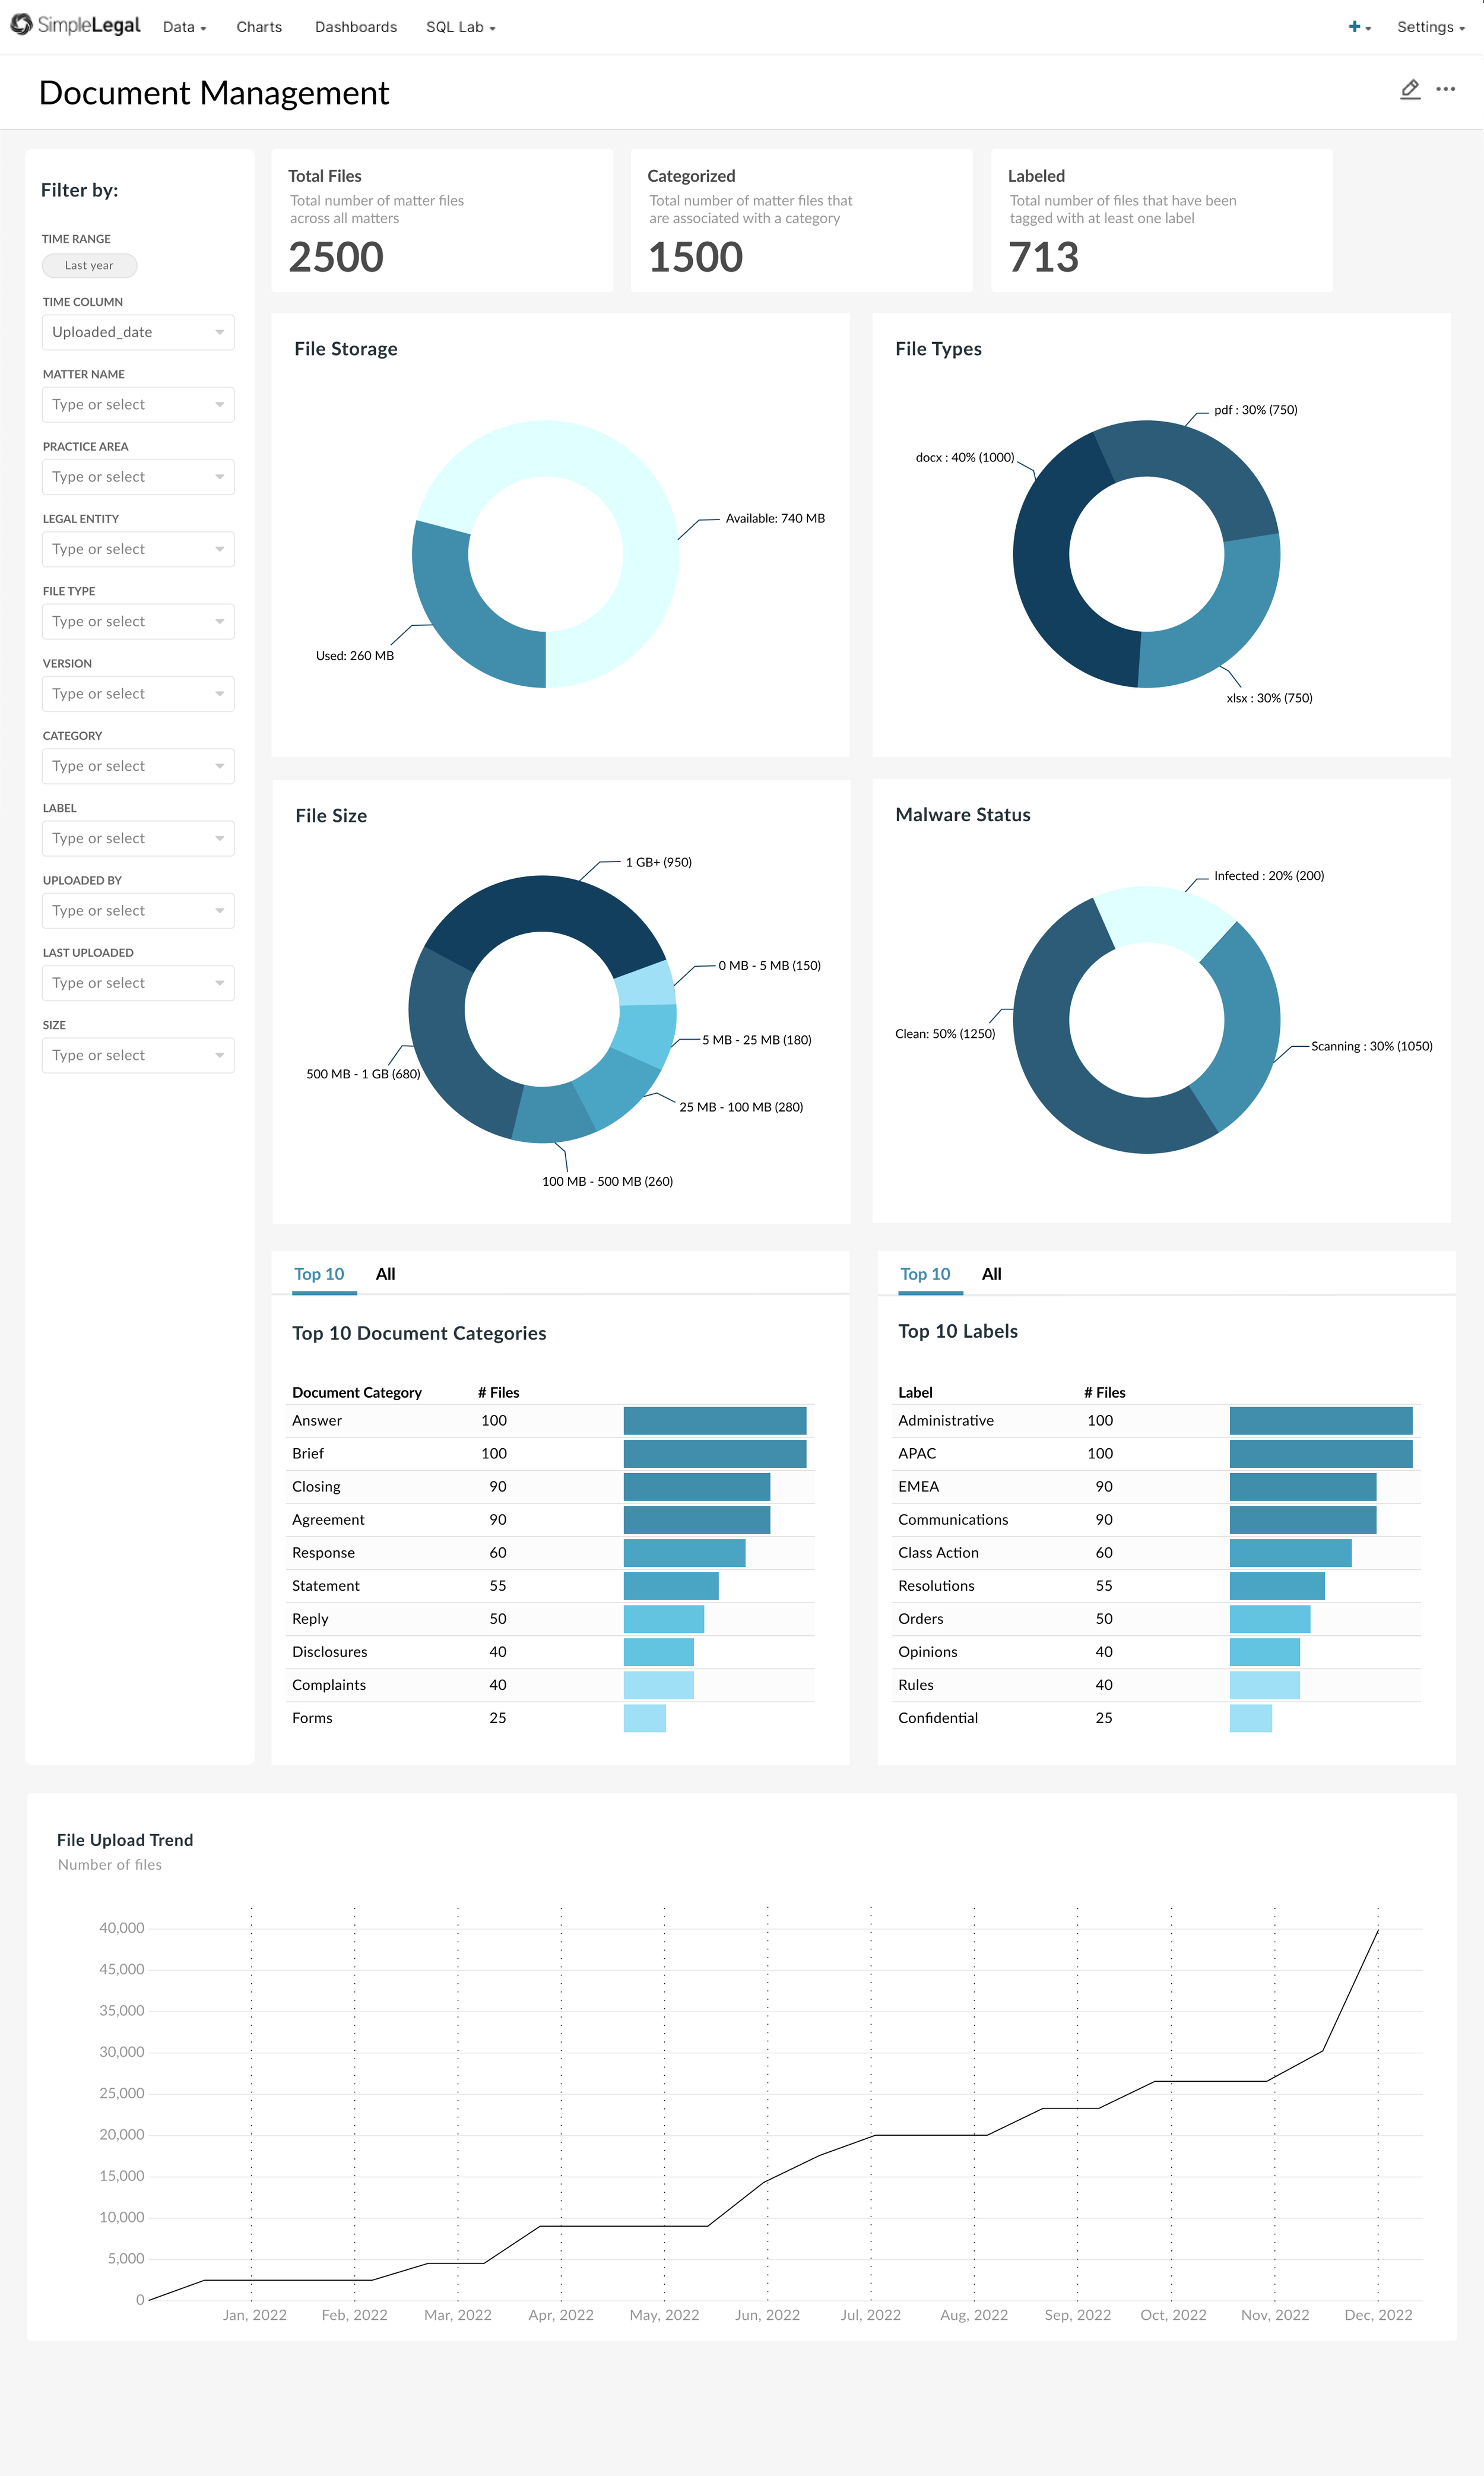
This report gives insight into document attributes to help the legal operations department prioritize document management.

This report gives insight into event attributes to help the legal operations department manage event deadlines and completion.
6. Impact & Outcomes
The project resulted in 100% client retention of at-risk customers and removed reporting as a reason for lost sales. The new reporting tool allowed users to:
Visualize and analyze data more effectively
Prove their impact in reducing outside legal costs
Make data-driven decisions with confidence
This success validated our design approach and demonstrated the importance of designing systems that cater specifically to the needs of our users and their industries.
7. Lessons Learned
This project taught me the importance of collaboration, especially with cross-functional teams that had previously experienced failure. We transformed skepticism into enthusiasm by involving them early in the process and giving them ownership. I also saw the value of creating scalable design systems that ensure consistency while allowing flexibility for future growth.